Mon Prof Augmenté
Area under a curve
Age 17 · Maths

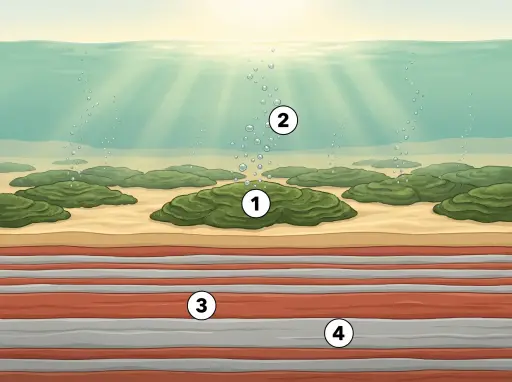
A positive function draws a curve above a horizontal axis. The area between the curve and the axis can be approximated by many thin vertical rectangles.
This picture is part of the full library
Every lesson is open to everyone for 7 days after it is published. This one came out on October 6, 2026: its text stays readable here, and its picture opens with a subscription.
The app is free. A subscription opens every lesson, in every school year.


In the picture
- The smooth curve: the graph of a positive function above the baseline.
- A thin vertical rectangle: its height matches the curve at that position.
- A segment of the baseline: the small width of one rectangle.
- The shaded region: the area under the curve being approximated by the rectangles.
Examples
- Estimating the area of an irregular garden by covering it with narrow strips.
- Adding up small time slices to estimate total distance from a speed graph.
Key takeaways
- Thin rectangles approximate the area under a curve.
- More, narrower rectangles usually give a closer approximation.
Quiz: Area under a curve (Age 17)
-
What does the approximation with thin vertical rectangles estimate?
-
In the approximation, what does the height of each thin vertical rectangle match?
-
According to the card, what usually happens when you use more, narrower rectangles?
The answers, each with its explanation, are in the app. This lesson has left the free week, so its quiz is part of the subscription.
Free app, optional subscription
App Store Google Play
Carry on in the app
At least one new illustrated lesson every weekday for your child’s year, with its quiz and a reminder at 6:15 pm.
Your child’s teacher does not use My Enhanced Teacher yet?
Tell them about it